Executive Interview: Fubo’s CEO Gives Business Update on Growth, Earnings and Lawsuit


Fubo’s Co-Founder and CEO, David Gandler, sat down down for an in-depth discussion about their lawsuit filed against Disney, FOX, and WBD, its Q1 earnings numbers, industry challenges around content licensing pricing and bundling and Fubo’s goal to get to profitability in 2025.

David defines antitrust, why Fubo believes the JV is anticompetitive and how the suit’s outcome could impact the entire industry. We also highlight why so many carriage disputes are happening, leading to a fragmentation of sports content and an unfriendly fan experience. We discuss the pricing and bundling of vMVPD services, including how Fubo picks RSNs to work with and why pricing for OTT services never goes down.

Finally, David recaps Fubo’s most recent earnings, including its subscriber growth numbers, lower net loss, the recent reduction of its debt, and Fubo’s operating plan as they work towards profitability.

Sponsored by

CDN Vendors Seeing More Pricing Pressure From the Largest Customers, Getting Less Traffic Commits and Growth

Some important data points about CDN pricing, vendor consolidation and market sizing came from Fastly earnings call and earnings results. For the first time, Fastly is breaking out revenue into three product lines: “Network Services” (solutions designed to improve the performance of websites, apps, APIs, and digital media), “Security” (products designed to protect websites, apps, APIs, and users) and “other” (emerging products offering which includes compute and observability products). In Q1, Network Services comprised 79% of revenue, Security 18%, and Other 2.7%. For all the talk in the cloud computing industry, very little revenue is being generated today across the industry from compute services.

The company discussed the challenges in the CDN business, saying they saw a “slight uptick from the typical level of re-rates with our largest customers, but we have not yet seen the commensary traffic expansion usually associated with this motion.” In other words, pressure on CDN pricing is as bad as always, with the largest customers demanding lower pricing, even without offering more traffic or larger commits. This is no surprise to me since this has been the trend over the past twelve months. Talk to the largest customers; it’s the same trend.

And yet, most on Wall Street have no insight into CDN market drives and restraints. Three weeks ago, Piper Sandler upgraded Fastly stock, citing “multiple upside levers” across the CDN business, and Fastly’s stock rose by 7% in intraday trading. The analysts said that Fastly could benefit from new business strength and a “favorable competitive landscape,” noting the exit of some competitors could help drive opportunities and favorable pricing for Fastly. But of course, that’s not reality.

Regarding industry consolidation, Fastly said, “We also will not benefit in 2024 from the favorable impact of the CDN consolidation that occurred in early 2023 that drove favorable sequential growth in the prior year same period.” In other words, StackPath and Lumen exiting the market won’t benefit Fastly in 2024, which no one should have expected, considering both vendors had such a small number of customers with a meaningful MRR. Fastly also said that when it came to their largest accounts, they “saw more pricing pressure than they are used to.”

Akamai acquired around 100 enterprise customer contracts from StackPath and said it would add approximately $20 million in revenue by 2024. That’s it. From the deal with Lumen for the CDN contracts Akamai acquired, the company said it would add approximately $40 million to $50 million in revenue for the full year in 2024. No one should have thought the exit of StackPath and Lumen from the CDN space would drive meaningful revenue to Fastly or any other CDN. Fastly said their top 10 customers represented 38% of total revenue in Q1, so any further impact on pricing for their largest ten customers will have a negative impact on revenue growth.

If you listened to Fastly’s earnings call, no one from Wall Street understood Fastly’s answers to their questions, and I can see why. Fastly projected no confidence with their answers and used terms like “aggressive” when talking about their wrong projections and “volatility” regarding what they saw in the market, with customers adding multiple CDNs into their traffic delivery mix. I don’t know why the company didn’t see any of these data points earlier in the market and failed to understand what’s driving lower pricing with less traffic commits. I could name multiple large customers who have been shifting more traffic to AWS and other vendors over the past few months and lowering rates simultaneously. Multiple large customers started renewal conversations in January, expecting new pricing to be secured in Q2. Fastly said they are reacting to what they see in the market with these large customers by  “changing their engagement model,” but why are they just changing it now? Related to sales, Fastly mentioned they are still interviewing for a CRO and have now been five months without one.

In Q1 of this year, I completed my yearly CDN pricing survey of over 500 customers and saw the lowest pricing rates I have ever seen for the largest customers, as low as $0.00038 per GB delivered in the US. Blended pricing globally at $0.0006. (Please note, this doesn’t mean these are the prices you should be asking for or paying!) Lower pricing is okay if traffic and commits are growing, but they aren’t. Contact me if you want details on what I’ve collected and the cost of the raw data.

Preview: Inside the NAB Show Streaming Summit: AI Innovation, Industry Trends, and Expert Strategies for Career Growth

This special podcast takes you inside the NAB Show Streaming Summit with a preview of all the content, speakers and expert strategies you’ll learn at the event. Hear what the keynote fireside chats will cover with Paramount Global, Prime Video and NBCU. We also give an overview of the new AI Demo Track and break down all the sessions tied to sports, content bundling, churn and retention, and streamlining video workflow strategies. Finally, we highlight case studies from NFL, SiriusXM, Disney+ Hotstar, and Sinclair and detail why you can’t miss the day one Happy Hour event. And if you’re feeling the sting of recent layoffs or seeking career growth, join me for an empowering talk on how to find a job, advance your career, set yourself up for success and stand out amongst the crowd.

SeaChange, Which Once Dominated the Cable TV Operator Market, To Be Acquired for $30M

SeaChange, which once dominated the cable TV operator market and had over $216 million in revenue, will have its assets acquired for $30 million. Under the deal, an unnamed “affiliate” of PartnerOne will acquire SeaChange’s assets minus SeaChange’s cash and cash equivalents at closing.

SeaChange was initially incorporated in 1993 as SeaView Technology and entered the market in 1994 with an ad insertion solution that allowed cable TV providers to send different advertisements to separate geographic areas so they could measure demographics, enabling advertisers to do targeted advertising. Other vendors offered tape-based analog systems at the time, but SeaChange’s digital solution resulted in faster upload times and less cost. In 1994, Time Warner in Manhattan was the first client for their product.

In 1995, SeaChange had $23 million in revenue, up from $5 million the year before. In 1996, it changed its name to SeaChange International as it expanded into European and Middle Eastern markets. In November 1996, SeaChange went public on the NASDAQ, selling 2.3 million shares of stock at $15 each, netting $24 million. Shortly after the IPO, SeaChange partnered with IPC to develop a VOD service for hotels, where I first remember encountering the company’s product. 1996, the company finished the year with $49.3 million in revenue. In 1998, SeaChange formed an alliance with Scientific-Atlanta to provide VOD equipment to cable operators at a lower cost than current systems in the market.

In 2000, SeaChange made a deal with Microsoft to develop a system to simultaneously encode video for television broadcasting over the Internet. Microsoft spent $18 million to acquire a 2% stake in the company. Later that year, Comcast Corp. bought a $10 million stake in the company and signed a long-term agreement to buy its VOD systems and services. By the end of 2000, SeaChange’s revenue grew to $85.2 million on just over $1 million of net income.

In 2001, the company issued nearly 3 million new shares of stock in a secondary offering that netted them more than $80 million and reported sales of $115.8 million in revenue for fiscal year 2002. For fiscal year 2004, the company ended with $146.1 million in revenue. In 2012, SeaChange’s revenue started to fall, with full-year revenue dropping to $197.7 million, and by 2017, it had come in at $83.8 million. By 2021, revenue was down to $22 million for the year. From 2012 to 2021, SeaChange’s revenue growth averaged a 17.2% decline over the ten years.

Within ten years of its founding, SeaChange International became the leader in video-on-demand and advertising insertion equipment for cable providers and broadcasters. The company once owned more than 60% of the market, but poor product choices, multiple management teams, competitors and a lack of discipline in R&D spending sank the company.

Updated: I should point out that while in the long run, SeaChange faulted in the market, Bill Styslinger, Edward Delaney, Jr. and Ed McGrath, who started SeaChange, deserve credit for seeing a problem in the market and inventing a solution. Bill left as CEO in 2011.

SeaChange Acquisitions

  • 1996: Acquired Horizon Systems
  • 1997: Acquired IPC Interactive Pte.
  • 1999: Acquired Digital Video Arts
  • 2002: Invested $2.3 million in On Demand Group
  • 2004: Acquired ZQ Interactive
  • 2005: Acquired Liberate Technologies non-US business
  • 2005: Acquired full ownership of On Demand Group for $13.4 million
  • 2005: Acquired a 19.8% ownership in Casa Systems

Thirteen Years of Super Bowl Streaming Viewership Stats, 2012-2024

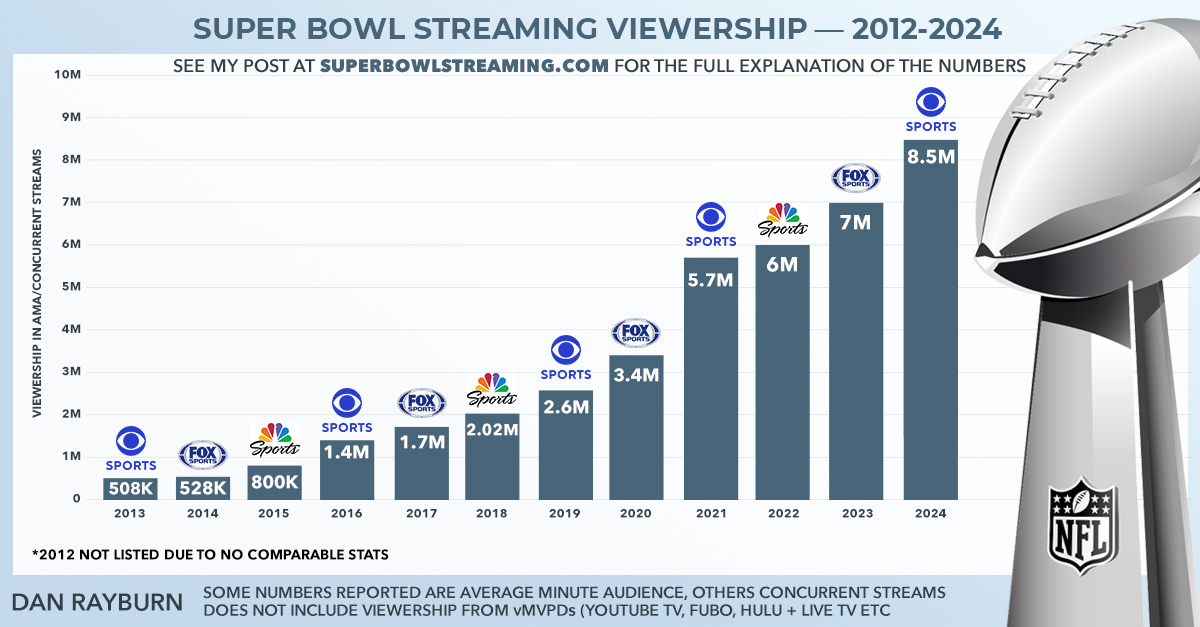
2024 marks the thirteenth year of broadcast networks streaming the Super Bowl. While many viewership numbers are compared to one another each year, there are a lot of variables between the games. In the early years, broadcast networks used the metric of simultaneous streams or current streams when reporting numbers, but as an industry, we have since switched over to the metric of AMA (Average Minute Audience). In addition, when viewership numbers are reported, no broadcast network reports any detailed breakout on how they define a viewer or how many unique viewers they have. Some viewership numbers report co-viewing numbers, while others don’t.

We also don’t know what percentage of users watch on a TV versus mobile, the average viewing time per user, the average bitrate streamed, or how many users watched on a particular platform since the numbers reported are across all digital platforms that offer the stream. For example, the app and website of the broadcast network, the NFL app and all NFL digital properties. For thirteen years of streaming the Super Bowl across three broadcast networks, FOX, CBS, and NBC, we have no detailed viewership info on what transpires during the live stream.

Over the years, I have seen Super Bowl streaming numbers misreported with numbers that have no source to them and don’t match the numbers put out each year by the broadcast networks. For example, Statista produced a chart saying streaming viewership for the 2023 Super Bowl was 21.8 million, which is inaccurate. The 21.8 million number refers to Out Of Home (OOH) viewers who watched the Super Bowl LVI in bars, restaurants, and other venues, including viewing in other people’s homes. To make it easy to get the numbers right, I have compiled a chart with viewership stats from 2013-2024 of all the numbers reported by the broadcast networks. I have excluded the first year the Super Bowl was streamed, in 2012, since the metrics released by CBS Sports are not comparable to any other year based on their methodology. All the numbers I highlight come directly from the broadcast networks’ press releases, except 2024.

  • 2024: This is the only year the broadcast network did not break out streaming media viewership numbers for the Super Bowl. However, based on my sources, I can report that Paramount+ had an AMA of 8.5 million. When you add viewership numbers from the vMVPDs, the AMA number totaled 11.7 million viewers. While Paramount did not put out these specific numbers, you can do the math from this post they published on LinkedIn and from talking to those involved.
  • 2023: FOX Sports says Super Bowl LVII delivered an average of 7 million simultaneous streams, up +18% over the 2022 Super Bowl. The 7 million simultaneous streams were across the FOX Sports app, FOX.com, the FOX NOW app, and NFL digital properties, including the NFL mobile app, the NFL Fantasy mobile app, NFL.com, the NFL connected TV app, and NFL+ for subscribers. The number does not take into account co-viewing from connected devices, and it should be noted that the 2022 viewership metric used by NBC Sports was AMA and not simultaneous streams.
  • 2022: NBC Sports said the streaming average minute audience (AMA) for Super Bowl LVI was 6 million across Peacock, NBC Sports Digital platforms, NFL Digital platforms, Rams and Bengals mobile properties, and Yahoo Sports mobile properties. NBC Sports says the 6 million number is “according to the traditional counting of streaming, which is the comparable metric to last year’s (2021) 5.7 million”. The delivery rises to 11.2 million AMA viewers, which takes into account “co-viewing from connected devices.”
  • 2021: CBS Sports said the streaming average minute audience (AMA) for Super Bowl LV was 5.7 million viewers. The live stream was available unauthenticated on CBSSports.com and the CBS Sports app across devices, ESPN Deportes digital properties across devices, NFL digital properties across devices, and on mobile via Buccaneers, Chiefs, Yahoo Sports and other Verizon Media mobile properties. The game was also available to stream live via the CBS All Access subscription service and for authenticated users on CBS digital properties.
  • 2020: FOX Sports said Super Bowl LIV delivered a streaming average minute audience (AMA) of 3.4 million, up 30% over 2019 (2.6 million) and up 103% over Fox’s last Super Bowl stream in 2017 (1.7 million). Fox’s streaming viewership was measured across FOXSports.com, the FOX Sports app, FOXDeportes.com, the FOX Deportes app, the FOX NOW app, NFL digital properties including the NFL app, the NFL Fantasy mobile app, NFL.com, the Kansas City Chiefs and San Francisco 49ers mobile properties and Verizon Media mobile properties, including the Yahoo Sports mobile app.
  • 2019: CBS Sports said the broadcaster’s airing of Super Bowl LIII drew an average streaming audience (note it does not say AMA) of 2.6 million during the game window, an increase of 31% over the streaming audience for the previous year’s game. The live stream was available unauthenticated across CBSSports.com, the CBS Sports app, NFL.com, the NFL app, and Verizon mobile properties — including Yahoo Sports, Yahoo, AOL, AOL Sports, and Tumblr. It was also available on CBS’s subscription streaming service, CBS All Access.
  • 2018: NBC Sports said Super Bowl LII had a streaming average minute audience (AMA) of 2.02 million and peaked at 3.1 million concurrent streams. The live stream was available on the NBC Sports app, NBCSports.com, NBC.com, TV Everywhere, the En Vivo app, NFL.com, the NFL Mobile app from Verizon, the Yahoo Sports app, and go90.
  • 2017: FOX Sports said Super Bowl LI had a streaming average minute audience of 1.72 million, up 23% over 2016 (1.4 million) and up 224% over FOX’s last Super Bowl stream in 2014 (530,523). The live stream was carried on FOXSportsGO.com, the Fox Sports GO app, the NFL app, as well as NFL Mobile and go90 for Verizon customers
  • 2016: CBS Sports said Super Bowl L had a streaming average minute audience (AMA) of 1.4 million, with 4 million unique viewers, and an average viewing time of 101 minutes. CBS streamed the game on its website, the CBS Sports app, and the NFL smartphone app, but only on Verizon.
  • 2015: NBC Sports said Super Bowl XLIX reported a streaming average minute audience of 800,000, with viewers peaking at 1.3 million and engagement of 84.2 minutes per viewer. NBC Sports Digital didn’t have NFL mobile streaming rights, so the live stream numbers are via NBC Sports Live Extra to desktops and tablets only.
  • 2014: FOX said Super Bowl XLVIII had a streaming average minute audience of 528,000 viewers and peak concurrent viewership of 1.1 million, with users spending an average of 47.8 minutes watching the stream.
  • 2013: CBS Sports said Super Bowl XLVII had a streaming average minute audience of 508,000 with an average viewing time of 38 minutes. The game was streamed on CBSSports.com, NFL.com, and Verizon on mobile. Note that the ratings figures for TV did not include 30 minutes when there was a partial power outage in the Superdome, but that was not excluded from streaming numbers.
  • 2012: NBC Sports said Super Bowl XLVI “attracted” a total of 2.1 million “unique users” with an average viewing time of 39 minutes. The live game stream was available on NBCSports.com, NFL.com, NFL Mobile, and Verizon.

I got all the numbers from the broadcast network’s press releases, but if you see an error, please let me know.

Update on CDN Market and Akamai’s Business, Key Takeaways From Full Year Earnings

I’ve highlighted some interesting numbers and takeaways from Akamai’s Q4 and full-year 2023 earnings for those tracking the CDN industry. At times, I hear some people suggest Akamai isn’t really in the CDN market anymore, which could not be further from the truth. The company still dominates the overall industry and is the largest player concerning every metric, including revenue, number of customers, and total traffic delivered. Akamai’s delivery revenue for 2023 was $1.542 billion and dwarfs the next largest competitor by 3-4 times revenue, based on a comparison of the same type and size of customer. Please note that Akamai does not report “CDN” revenue but “delivery” revenue.

It is accurate that revenue growth in the CDN market has slowed over the past few years, with my CAGR estimate for the entire market in 2023 being 1-2%, excluding China. Akamai’s full-year 2023 delivery revenue was down 8% and is expected to be down again in 2024, year-over-year. Everyone following the CDN market knows it’s a tough business with high capex costs, low margins and competitive pricing. The removal of Lumen and StackPatch from the market will help remaining CDNs concerning renewals since those two vendors offered some of the lowest pricing in the market. That’s not to say they were successful in winning business from Akamai or other CDNs, but at times, they would get a small share of the overall traffic in a multi-CDN mix, or customers would use their pricing to negotiate against Akamai and other more prominent CDN vendors.

While fewer CDN vendors are in the market, customer traffic growth hasn’t accelerated significantly, pricing is always competitive, and many video customers have optimized their encoding, resulting in fewer bits delivered. The CDN business is all about the economics of scale for efficiency and profitability, and the focus is on taking on the right customers at the correct pricing and cost structure. Akamai highlighted this strategy and said they would continue to focus on reducing unprofitable traffic, including peak traffic. They also stated they would start charging a premium to deliver traffic in harder-to-reach places as it looks to right-size its delivery cost in these markets with the revenue it generates. This is smart business and is what every other CDN is doing.

Seven of Akamai’s top ten CDN customer contracts come up for renewal in 2024. They will be concentrated in the first half of this year, so the company is expected to take a temporary hit in overall revenue growth, which we have seen happen every few years during significant contract renewals. Akamai notes that select contracts Akamai acquired from StackPath and Lumen accounted for ~$20M in revenue in Q4 last year.

Some vendors in the market, especially smaller ones, like to claim Akamai has a “legacy” network for CDN services and isn’t “next generation,” which is laughable. The numbers tell the story. While Akamai didn’t discuss this on their earnings call, I will report that for both the NFL Wild Card game on Peacock and the Super Bowl stream on Paramount+, Akamai had the majority of the video traffic. There is nothing “legacy” about their CDN, and they are at a size and scale that, so far, no other CDN has gotten close to.

Of course, one could argue it doesn’t make sense to get as large as Akamai anymore due to the delivery market’s lack of overall revenue growth, the low margins, and the high capex costs of running the business. That’s a fair argument, which is why CDNs now make most of their money on RSVP fees for one-off live events, not bit delivery. If a CDN is going to put more capacity in place for an event, they want to guarantee revenue from the RSVP fee they charge, regardless of the traffic that might show up. It’s smart business on the CDN’s part and shows how much they all take cost into the equation.

I will have a more extensive post soon with an update on the overall CDN market and a second post on why Akamai’s CDN scale is important for other segments of their business. Yesterday, they announced their plans to push generalized compute out to the edge in what they call their Gecko edge computing initiative. Akamai is in a unique position to do what few, if any, CDN providers can: bring the cloud and edge together into a single continuum of computing.

Updated February 21, 2024: A recently published report claims that Akamai is in talks with some very large media customers about offering “free delivery of video traffic” in exchange for “signing over a significant portion of their cloud computing workloads.” Akamai tells me this report is “inaccurate” and that giving anything away for free “never makes sense.” Like all vendors, Akamai always discusses additional discounts with customers who increase their aggregate spend across the company for multiple services. But that doesn’t mean Akamai’s services are being offered for free, as that’s not a good business practice. For those who understand the CDN business, the economics do not allow video delivery to be given away as a loss leader.

Note: I have never bought or sold stock in any public CDN ever, including Akamai, Edgio, Fastly, Cloudflare, Amazon, or any other vendor listed at www.cdnlist.com

Live Blogging Super Bowl LVIII Stream on Paramount+ Across Devices

The Paramount+ live stream of the Super Bowl has started and is 1080P 60fps true PQ HDR, has no color space conversions and is encoded for six bitrates maxing out at 12Mbps. The CBS Sports app stream requires TV Everywhere authentication and points to a local affiliate. Various MVPDs and vMVPDs are picking up an upconverted 4K stream, but Paramount+ will not have the upconverted 4K stream themselves. Paramount+ has a free trial and has both the local affiliate feeds, which is the case for standard NFL games, and a national stream. NFL+ is also streaming the game on phones and tablets.

The 2023 Super Bowl by FOX Sports delivered an average of 7 million simultaneous streams across all FOX Sports and NFL digital properties without co-viewing. I expect Paramount to have a larger audience this year, but not by that big of a percentage. I will be live blogging the stream starting at 6pm ET, so check back here for updates.

10:55pm ET: Game over. Like many Super Bowl streams where users have tech issues, it is hard to judge how widespread they are and what percentage of viewers were impacted. I don’t expect Paramount to disclose the nature of the problem or what vendor was the root cause of it. Viewership numbers will be out in the next day or two, but they won’t be detailed enough to know what percentage of “viewers” had a good user experience versus those that did not since they are all counted as the same.

9:08pm ET: The tech issue has largely been migrated by now (unless I get permission, I am not disclosing what it was), and fewer error messages are being reported on Twitter.

8:45pm ET: No issues for me with the stream during the halftime show.

7:50pm ET: The streams on Amazon, Fubo, and YouTube TV have been rock solid for me.

7:30pm ET: The stream on Fire TV and Apple TV crashed. Same error message. While the stream’s uptime has improved, it’s still not been as stable as it should be.

7:14pm ET: This news report is inaccurate: “The streaming platform seems to be struggling with all the Super Bowl traffic.” The technical issue was not due to the “volume” of traffic Paramount was receiving. I see the highest number of problems reported around 5:30pm ET, with fewer reports coming in at 6pm. However, users still say “video is currently unavailable” errors as of 7:00pm ET. Some are reporting the stream is back up but at a lower quality (720). I was getting 5.1 on Fire TV, but I am no longer. I was getting HDR on Roku.

7:00pm ET: Latency on the MacBook Pro is 30 seconds, which is expected for desktops. The latency of the Paramount+ stream via Prime Video is 2 seconds, and the Paramount+ app on Apple TV is averaging 8 seconds behind the CBS pay TV feed.

6:50pm ET: The stream across YouTube TV and Hulu has been looking good for me. I see very few technical issues being reported online for either service by users.

6:29pm ET: The number of reports of the stream not working on Twitter has dropped dramatically. It is working for me across all devices.

6:00pm ET: The Latency on the stream for me is 10 seconds on Fire TVs and LG TVs.

5:48pm ET: Many are reporting the stream is still down for them. A tech problem somewhere in the video workflow.

5:39pm ET: The stream is back up now for me.

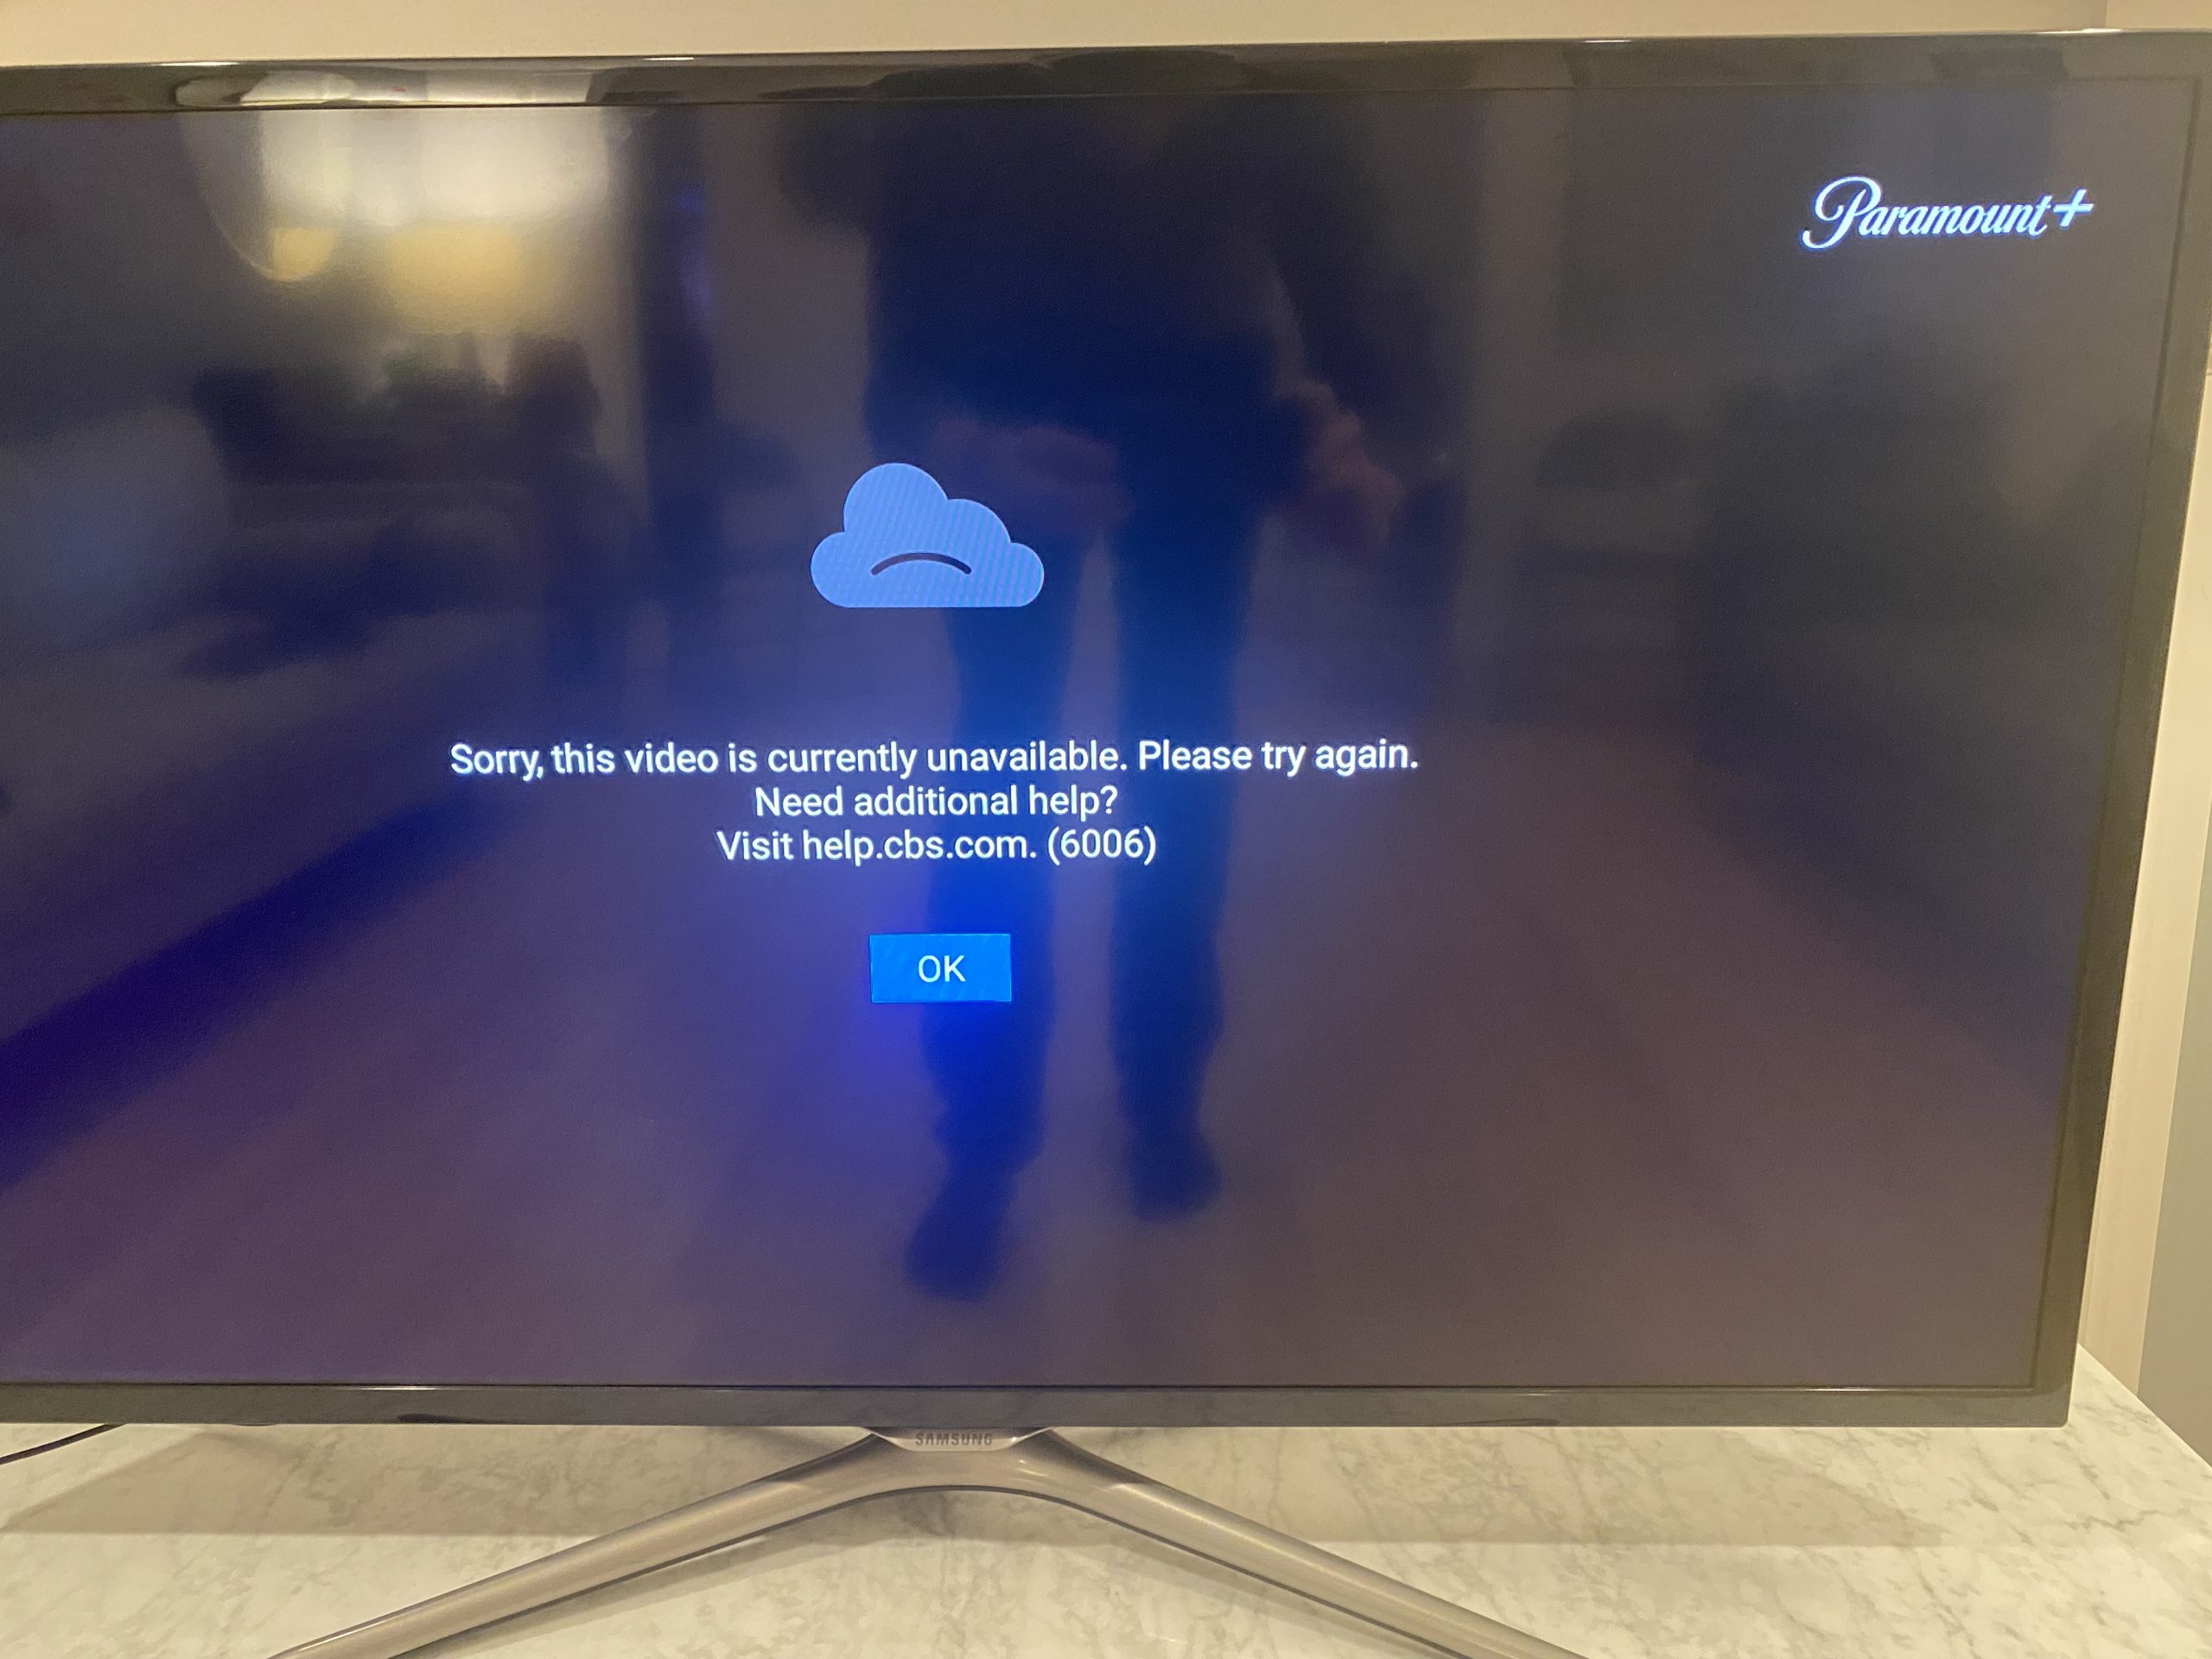
5:30pm ET: The stream is down for me across streaming boxes and TVs, with an error of  “Sorry, this video is currently unavailable. Please try again. (6006)”. Others are reporting the same error.

2:30pm ET: I’m using three different Paramount+ accounts across Roku Streaming Stick 4K (3820X2), Apple TV 4K (A2843), Amazon Fire TV Stick 4K, Amazon Fire TV Stick 4K Max, two LG OLEDs (55C9AUA/65BXPUA) and two Samsung TVs (UN40F5500AF/QN65S90CAFXZA).