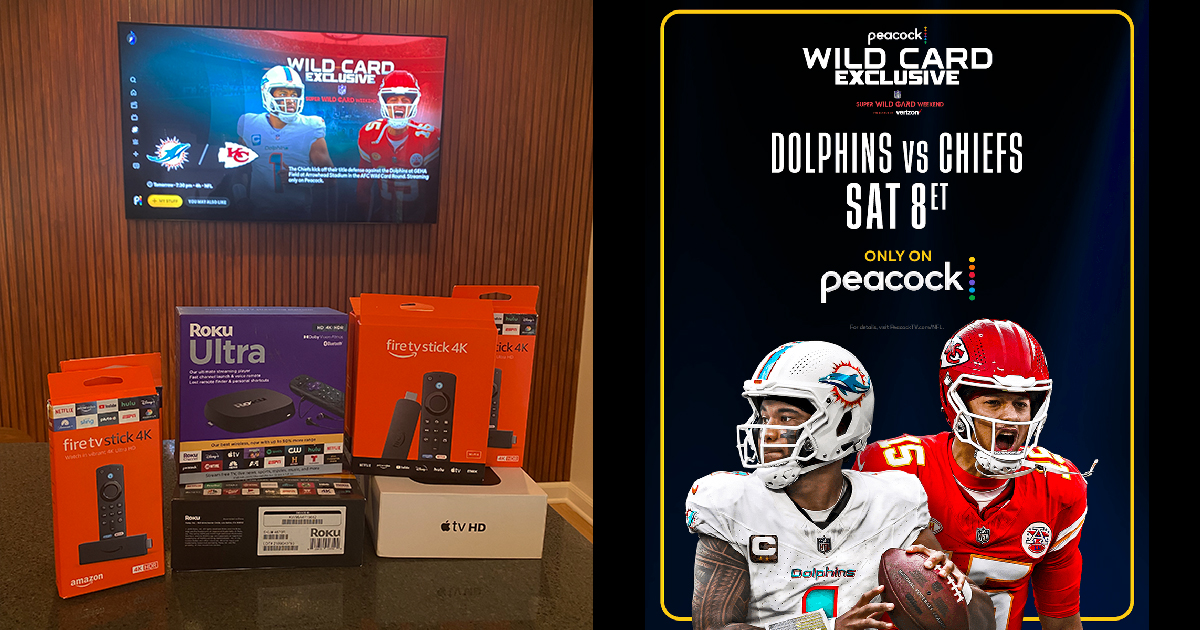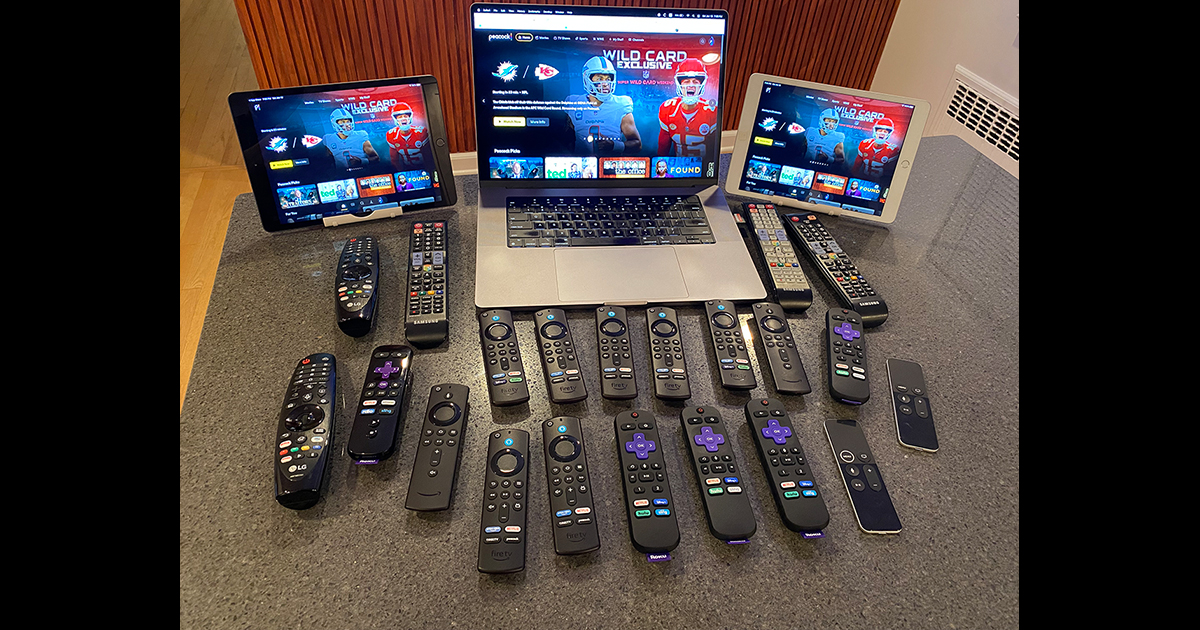
I am live blogging Peacock’s exclusive NFL Wild Card game between the Chiefs and Dolphins, kicking off at 8 pm ET and monitoring the stream across a dozen devices 20+ devices, including multiple models of Apple TV, Fire TV, Roku, Samsung, and LG TVs. Also, various iPads, iPhones, and MacBooks. All devices are connected via ethernet except for iPads and iPhones. I’m never running more than 3 streams at a time and have two internet connections, Verizon and Optimum, at 300 Mbps or greater.
Local NBC stations in Kansas City and Miami will air the game; otherwise, you need a subscription to Peacock or, for viewing on mobile devices, NFL+. Peacock offers a special price of $29.99 for 12 months and a 50% discount for new subscribers using the code PEACOCK2024.
Peacock’s exclusive regular season NFL game last month on December 13 averaged 7.2 million viewers across Peacock, NFL+ and local NBC TV stations in Los Angeles and Buffalo. Adding out-of-home viewership, the game peaked at 8.3 million viewers. The game peaked with 5.7 million concurrent devices using Peacock, and Peacock’s President said they are preparing to handle 5-6 times that number for the playoff game. I do not expect NBC Sports to break out Peacock-only viewers, but I will guess that the average viewership across local TV and digital platforms combined (Peacock and NFL+) is 15-20 million viewers. Peacock had some technical issues during their December game, mostly with what looked like HDR support, so I am hoping they have that all resolved now for the Wild Card game.
Sunday, Jan 14, 10:33 PM ET: Viewership numbers are out. Nielsen says the NFL Wild Card game of the Chiefs and Dolphins had an AMA of approximately 23 million viewers across Peacock, NBC stations in Miami and Kansas City, and on mobile with NFL+. Across all platforms combined, the game peaked at 24.6 million viewers and reached 27.6 million viewers. NBC Sports says Peacock delivered its largest single-day ever in audience usage, engagement, and time spent, with a record 16.3 million concurrent devices. (No details were given on engagement or time spent)
NBC Sports says Peacock “set the record for the most-streamed live event in U.S. history” and “drove the Internet to its largest U.S. usage ever on a single day and the largest Internet event ever, consuming 30% of Internet traffic during the game.” But NBC Sports doesn’t say the source for this statement or the data they are referencing.
As expected, the NBC Sports press release said Comcast “executed flawlessly” with their “streaming experience,” ignoring every user who experienced technical issues. No doubt the game was big, but ignoring all the technical problems encountered by viewers is disappointing.
11:20 PM ET: Game over. NBC Sports will put out viewership numbers in a few days, but that one metric alone doesn’t allow us to judge the success or failure of Peacock’s streaming experience for their exclusive NFL Wild Card game. We don’t know and will never be told what percentage of total viewers had a poor viewing experience versus users who saw no buffering, audio sync issues, application problems, login and billing issues, or other reported problems. The larger the audience, the more technical issues we would expect to see. Like all of these streaming events, we won’t get details on the average bitrate, average viewing time, profit and loss, or other methodology we need to judge the actual success or failure of the event, short or long-term.
I saw far too many problems reported online of varying kinds across all quarters of the game, more than I would have liked to see. It is also important to remember that some viewers signed up for Peacock for this one game, making it feel like a PPV event to them. Some will cancel their Peacock subscription now that the game is over and churn off immediately. So, it will be interesting to see Peacock’s subscription number for Q1 when Comcast reports earnings in April.
I expect the NFL and NBC Sports to call the game a huge success and use lots of grand marketing terms to say how great it was for the league and the future of the NFL and probably even call out that they reached a younger audience. In reality, younger fans are not hanging out on a Saturday night on Peacock or Friday nights on Apple TV+ for Friday Night Baseball. Peacock, Apple TV, and Amazon Prime Video are services, not platforms, and younger sports fans spend their time on platforms like Twitch, TikTok, Discord, and YouTube.
All that aside, we must be honest with ourselves in the industry. Streaming media is not a replacement for broadcast TV regarding reliability, ease of use and quality of the video experience delivered. That’s not a knock on the technology or use case, just reality.
11:011 PM ET: It’s not surprising, but there are many reports of bars nationwide not having the game available for viewing. For a commercial establishment to carry the game, they must get the Peacock Sports Pass from EverPass for $206.99 for the year if paid monthly or $176.99 annually.
10:58 PM ET: From Q3 kickoff to the start of Q4, Peacock ran 11 ad slots, totaling 4 minutes, based on what I recorded using a timer. From Q1 to Q3, I’ve counted more than 35 different brands running ads.
10:15 PM ET: I’ve been busy looking at comments being sent to me along with screenshots, so I haven’t had a chance yet to check the Peacock app on Samsung or LG TVs. I’m also getting a lot of messages on LinkedIn that I am trying to follow up on. There is a lot more I wanted to look at and test across all these devices, but I just never had the time to get to it.
9:53 PM ET: From the start of Q2 to the halftime show, Peacock ran 15 ad slots, totaling 4 minutes and 30 seconds, based on what I recorded using a timer. From kickoff until the halftime show, they ran 38 ad slots, totaling 12 minutes and 15 seconds. All ads looked burned in, and I did not see DAI being used.
9:43 PM ET: With regards to latency, when compared to live radio and users in Kansas City giving me reports from their local TV feed, the streaming latency is as low as 10 seconds and as high as 25 seconds, depending on the device. I saw the highest latency on Roku, which is normal. Fire TV was a little faster for me than Apple TV.
9:20 PM ET: On the video delivery side, Akamai, Amazon, Edgio, Fastly, Lumen and Qwilt are in the mix for delivery, as reported by what I am seeing and what ISPs and others have told me. Two ISPs told me the game has now hit the highest recorded amount of traffic on their network. Comcast recently said that Amazon’s TNF game “comprises roughly 25 percent of all internet traffic on Thursday nights” and that it single-handedly “moved peak data usage on our broadband network from Sunday night to Thursday night.” It will be interesting to see the numbers from ISPs when the game is over.
9:08 PM ET: Regarding problems some viewers see, anything tied to the Peacock app, audio and color issues are on Peacock’s end. But buffering and choppy video could be last-mile issues with ISPs. It’s always hard to know for sure. I don’t know what percentage of users are having problems, so I have not used the words “widespread” or the like since I don’t know how many users are having problems and how many are not.
8:58 PM ET: From kickoff to the end of Q1, Peacock ran 23 ad slots, totaling 7 minutes and 45 seconds, based on what I recorded using a timer.
8:46 PM ET: Across six Twitter hashtags and Peacock accounts, I can’t keep up with all the negative comments, with many posting images or videos (2) (3) of the problems they are seeing. My stream has been good on Fire TV and Apple TV, but I am seeing some audio sync issues on Fire TV.
8:24 PM ET: I’m seeing complaints from users experiencing audio syncing issues, error messages, problems with colors, choppy video, and lots of audio complaints. Some users report payment errors as well.
8:00 PM ET: The stream is live and looks good for me on a few of the devices I have tested it on. Across iPads, the stream is six seconds behind the stream on Apple TV and Fire TV. For the Peacock stream of the Cleveland and Houston game, the stream averaged 15 seconds behind the pay TV feed.
7:17 PM ET: I am monitoring 12 accounts, hashtags, and discussion threads related to the NFL, NBC Sports, and Peacock across Twitter and reddit, in real-time across three iPads, seeing as many comments as possible.
5:52 PM ET: Scammers are hard at work today, knowing many consumers are seeking details about Peacock’s exclusive NFL Wild Card game. Consumers who don’t know any better are coming across multiple fake Peacock websites and getting emails that offer a 7-day free trial to Peacock, except all the offers are fake, and Peacock offers no free trial. I see many comments across the web with people complaining to Peacock, who has to explain that it’s not a legitimate offer. One of the websites is peacockfreetrial, whose name server is in Kenya.
10:37 AM ET: Peacock is already trending on Twitter with many angry comments about consumers having to pay for the game. I know Peacock doesn’t think of this as a PPV event, but for many football fans who only want to see the game and not add another OTT subscription to their household, that’s what it is: a PPV fee to see an NFL Wild Card game. Fans shouldn’t blame Peacock; the NFL sold the game off to them.
NBC Sports executives are reinforcing that this is not a PPV event since a Peacock subscription gives you access to other live sports content, like NCAA Women’s Basketball and WWE, but many football fans see no value in that. There is a difference between an NFL fan and a general sports fan. I watch some NFL games but would never be interested in basketball or WWE content, while other consumers would. But the point isn’t how NBC Sports thinks of their Peacock service; all that matters is how consumers view it. And many consumers are referencing this NFL Wild Card game as a PPV event, whether NBC Sports agrees with that or not.